A Taxonomy of Graph Use Cases

For the past year I have been doing a deep dive into when to apply graph technologies in a large fortune 10 healthcare company. I have worked with hundreds of teams and thousands of people from a wide variety of domains including claims, providers, members, clinical, hardware, software services, security, human resources, training, strategy and search. When I started this process I had a small checklist in my mind about what types of problems were a good fit for graphs. For example, here is a list of “when to consider graph databases” as a possible solution based on my prior work with graph databases:
- When you have lots of relationships in your data
- When you need to traverse many relationships quickly
- When you have high variability data that does not fit well in a table
- When your current system is not working out because of slow joins in RDBMS systems
- When you want to do real-time analytical queries
- When your data model is constantly changing
- When you have complex rules that need to be calculated quickly
- When you want to integrate disparate data sources
- When you want to combine natural language processing (NLP) data from documents
- When you need to link data to metadata (versioning, provenance and linage, models, data validation, data quality checks) with your data
- When you want to be able to visualize groupings of data based on connections
- When you are looking for specific patterns in your data
- When you want to be informed if there are anomalies in data (data discovery)
- When you want to quickly compare new data to existing data for possibly merging data (master data management)
I also had a list of requirements where that graphs don’t work well by themselves (blob storage, document relevance ranking, pre-computed aggregates). These were somewhat random thoughts that were not really organized in any coherent way. Then I started to see some patterns. Rules 1 and 3 were really the same thing: rule 3 (slow joins) is really just a symptom of rule 1 (lots of relationships). In the same way rule 2 (variability of data) and rule 5 (changing model) are also getting at the same idea. A changing data model often means that data variability is only being discovered when analysis is being done. So I started asking, is there some way to redesign this flat list to group similar use cases together so we could better organize our growing list of business use cases?
If you have ever tried to group similar items together you are starting to build a classification system. You are building an initial taxonomy of concepts. Building taxonomies is something our brains do all the time. Sometimes we are not even aware of it. What is important to know is that you can give the same flat list of items to different people within different backgrounds and they will come up with radically different taxonomies. This is something I learned the hard way early in my career. I had a chance to work with some people with a formal background in library science and they recommended a great book on the topic called “Women, Fire and Other Dangerous Things” by the brilliant cognitive linguist George Lakoff. After reading this book my respect for field of library science increased dramatically.
I realized how difficult it is to get people from a diverse background and diverse needs to agree of a simple way to classify data. Classification also can be very biased based on the views of the group that is doing the classification. For example the Dewy Decimal system classifies Religion into categories like “Christian” and “Other”.
So I am very aware of bias and this has been on my mind as I started to build a taxonomy of use cases. The first step is to start to gather some data points. It makes sense to look at the most popular graph database: Neo4j. Here is a list of how they classify graph use cases:
- Fraud Detection
- Knowledge Graph
- Network and Database Infrastructure Monitoring for IT Operations
- Recommendation Engine & Product Recommendation System
- Master Data Management
- Social Media and Social Network Graphs
- Identity & Access Management
- Privacy, Risk and Compliance
- Artificial Intelligence and Analytics
What is different between my initial list of use cases and this list is that my initial list is based around key features of a graph databases that differentiate them from relational databases. The Neo4j use cases are much more-solution oriented.
One other somewhat objective way to classify graph usage is to look at the autocomplete list offered by search engines like Google. If you type “using graph databases for” the autocomplete list give me the following:
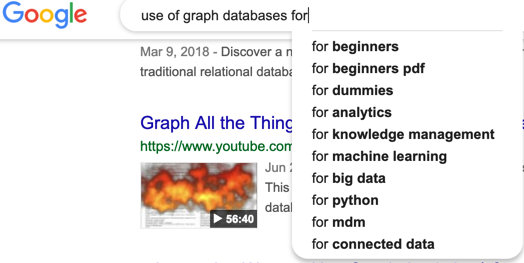
Here we see some material for getting started and languages (python), but the patterns of analytics, knowledge management, machine learning, big data, mdm and connected data are somewhat consistent — although with some variations. For example the Google autocomplete list has knowledge management, not knowledge graph. You can also add a single additional letter and find that bioinformatics, comparison, data lineage, flexible schema and time series are all suggested by the autocomplete.
So now that we have a list of topics we can start to look for high level patterns. Here are some that I found:
- Performance of relationship queries — any use cases that need to quickly traverse many complex relationships. This really includes fraud detection, social network analysis, network and database infrastructure etc.
- Flexibility of the model — any use cases that depend on new data being added without disruption of the existing query pool. Model flexibility includes linking of metadata, versioning data and continuously adding new relationships.
- Fast and Complex Analysis Rules — when you have to execute many complex rules such as comparison of subgraphs. This includes recommendations, similarity calculations and master data management.
This is not a one and done category. Some industry-specific use cases will draw from multiple areas areas of graph use case taxonomy. The more matches you find the better the problem might be solved by a graph database.
A sample taxonomy of the use cases is shown at the top of this article. You can use this as a starting point when building your own use graph use case taxonomy or start from scratch. What is important is that you also realize this is not really a strict single-match taxonomy. Any business problem will often contain multiple use-cases and link into this taxonomy in multiple places.
Whether a graph database is a BETTER fit for your use-case than another databases type (like key-value, column, family, document or a multi-modal) is another problem. There are tools such as the Architecture Tradeoff Analysis Method (ATAM) that can objectively score the fitness of different database architectures using a formal process call utility tree analysis. I also cover that process in my book, Making Sense of NoSQL. We will cover that process in a future article.
I hope you found this article useful to see if graph databases might be a good fit for your project. Let me know if you have other ideas on how to arrange your use-case taxonomy.